The overview is an important part of Task 1. It is in the Task Achievement criteria and it can be difficult to know what it actually means. One of the examiners that works with us explains what an overview is and how to identify it.
An overview is basically the main trends you see in data; the key standout features. In the Academic Task 1, there are nearly always two. It is clearer if we look at some examples so you can see.
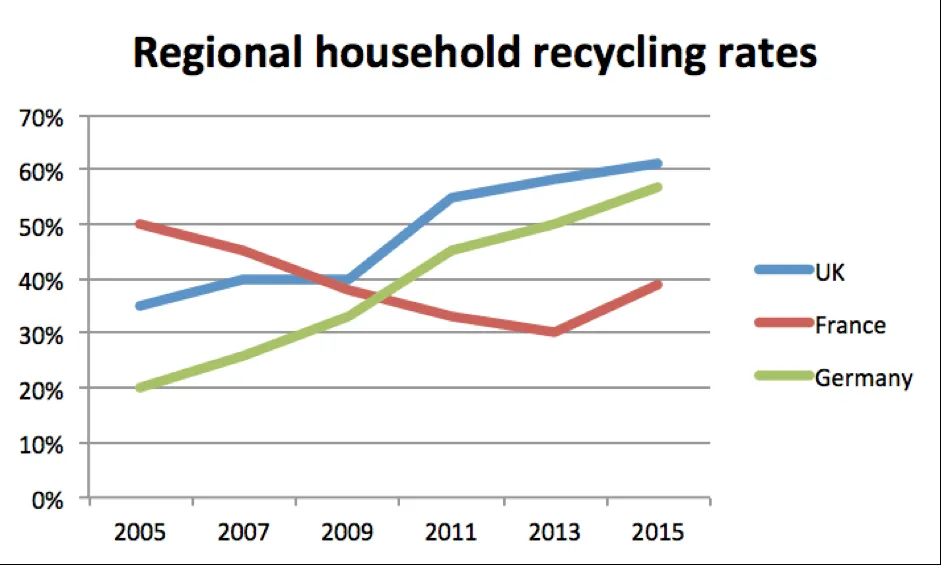
In this Task, the two standout features are how recycling increases in the UK and German but not France, and the highest growth was in Germany. This is a very common pattern you will find in IELTS where there is a general upward/downward trend and one grows more than the others.
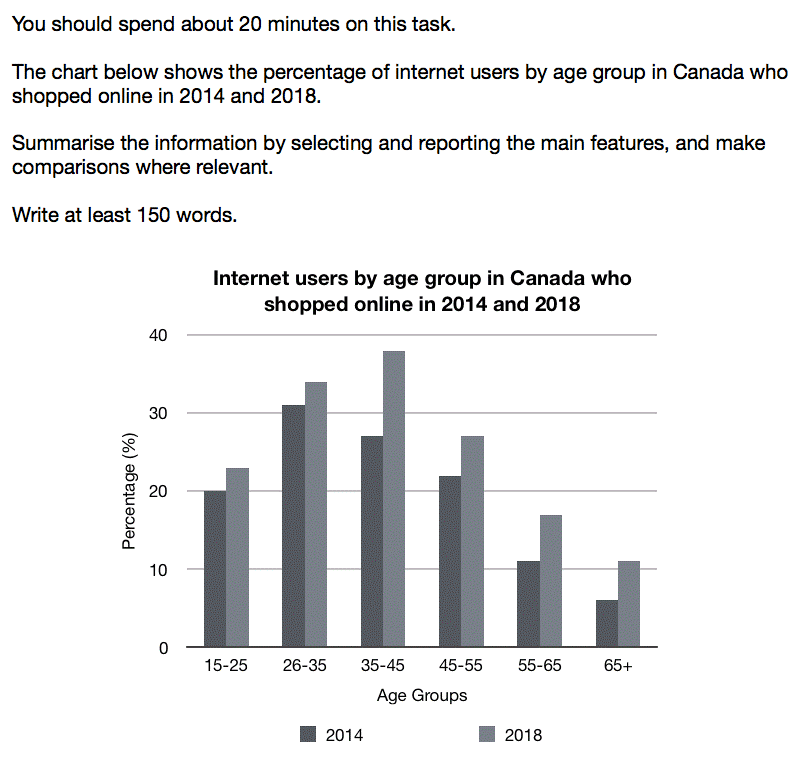
In this Task, the standout features are the increase in internet shopping over the time period and how it is more popular with the under 55s. If you are faced with ages, it is a good idea to see if there is a clear divide in the under and over 50s, for example.
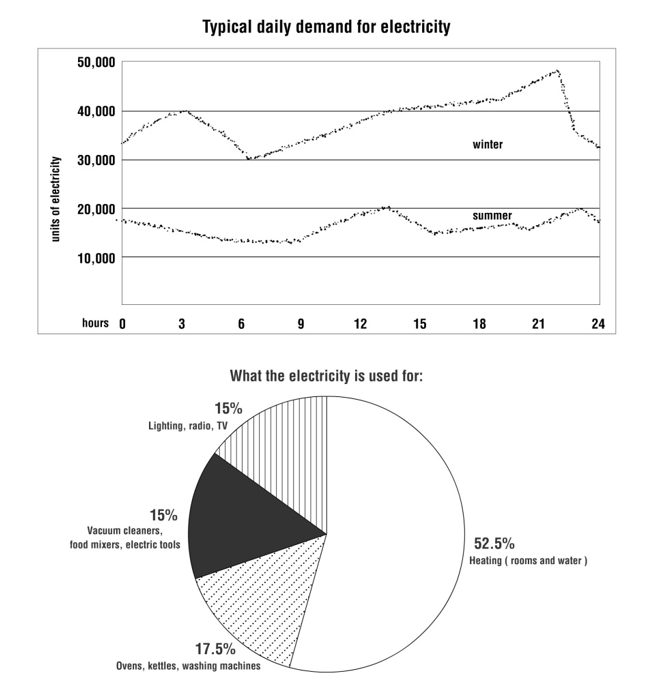
In this example, there are two data sets but the pattern is the same; there are two parts to the overview. The first feature is that more electricity is used in winter than in summer, and the second is heating accounts for most electricity use.
It is a very good idea to practice writing an overview and adding it to your introduction. This means that you should aim for writing 3 paragraphs in general.
Paragraph 1 – Paraphrase the data and write your overview; remember, there are 2 standout features to add.
Paragraph 2 – Data presentation
Paragraph 3 – Data presentation
One thing that I see a lot of these days is people making their own IELTS Tasks and posting them on the internet. They are not IELTS standard and are often overly complicated. Make sure you get your IELTS questions from official sources.
If you want to try a Task 1, you can order one here and have an IELTS examiner evaluate your writing. You can also join our private group on Facebook and ask questions there too or on Quora in our IELTS writing and Speaking Space. Or you could just use the comments section on this post!
Hi admin, can you give an example of overview for task 1 with process and maps?
Hello Anugrahita
A good question. For a process, it is usually something like,
The picture shows the production of milk from production to reaching customers on the shelf. Overall, it can clearly be seen that there are 6 steps in milk production, beginning with milking cows and ending with it being put on the shelves in supermarkets.
As for maps, you could write something like
The given map shows the changes that have taken place in Middle village from 1995 to the present. Overall, it can clearly be seen that a large amount of construction has occurred yet there are still areas that have been left intact.
It depends on the pictures that IELTS gives you but these can generally be used for both. Just make sure that it is clear and concise and focuses on the main trends.
Thank you for your question.
The upmyielts team
Do you give classes for IELTS? I tried lots and no one knows about IELTS. I tried exam 4 times and get the same every exam. I need real help from examiner.
Hello Saray. We are sorry that you have had so many problems with IELTS. You are not alone though. You can book classes with an IELTS examiner here
https://upmyielts.com/product/ielts-classes-with-ielts-examiner/
Usually, 3 to 4 classes is enough to show you what you need to do with the writing and speaking parts of the exam.
Get in touch with us if you have more quesitons. We will be happy to hear from you.
Best wishes
The upmyielts team
Hi admin, I just want to ask 2 questions:
1. Are there any trends in a chart with no time (e.g a bar chart compares different age groups and different categories such as the use of radio versus the use of Internet to access news), because I just write the highest/lowest figures? And if there are, could you suggest any ways to find a trend in such chart.
2. Could you please explain for me the sentence ‘If you are faced with ages, it is a good idea to see if there is a clear divide in the under and over 50s, for example’ in the second chart, because I don’t understand the phrase ‘clear divide’
Thank you for answer!
Hello
Thank you for your questions.
1) There are always trends in Task 1 and not all Task 1s have a time reference. For example, there are tables that just look at the figures. There is one about cinema viewing figures in different countries (Sorry, we can’t post pictures in comments!) and there is no time reference. In a table like this, there is always one country where the action (in this case cinema viewing) is more popular , and a genre (in this case types of films) that is more popular than the others. These are the main trends. We can email the task if you like.
2) When there are a range of ages in a graph, sometimes you can divide the data into over 50s and under 50s, for example. You will find that the over 50’s have a similar trend (perhaps upwards) over time, and the under 50’s trend downwards. It is always a good idea to look for this if you are faced with this type of question.
Thank you for your questions, they are good ones.
Best wishes
The upmyielts team
Oh, I see. Thank you for your useful answers. But if there is no ‘clear divide’ in the bar chart with different ages, is it still OK to write 2 paragraphs with the under 50’ (15-25, 26-35, 35-45) and the over 50 (45-55, 55-65, 65+). Thank you again!
Oh, I see. Thank you for your useful answers. But if there is no ‘clear divide’ in the bar chart with different ages, is it still OK to write 2 paragraphs with the under 50’ (15-25, 26-35, 35-45) and the over 50 (45-55, 55-65, 65+). Thank you again!
Well, if there is no clear divide then do not try to force a divide. If ages are part of the measurements, then there is nearly always a divide in Task 1. Don’t invent one of force one though. The data in Task 1 is always clearly divided. It may be a time, a quantity, or age, for example. Only divide the data by age if there is a pattern.
Please let us know if you have any more questions.
The upmyielts team